Tool and equipment rental income varies enormously by category, driven by three things: replacement cost, rental frequency (how often an item actually gets rented), and wear-and-tear rate (how fast rental use degrades it). A single generic income figure across all equipment types is close to meaningless. This article breaks down how each major category tends to perform, how to estimate income for a specific item without fooling yourself, and when an item simply isn't worth listing.
This assumes you've read the peer-to-peer equipment rental platforms overview. This goes deeper on realistic earnings. One caveat throughout: income figures vary significantly by local demand and must be validated in your own market, not assumed from category averages.
Power Tools and Construction Equipment
Demand: moderate to high in most markets. Homeowners tackling occasional projects and small contractors filling gaps both rent rather than buy, and project-driven demand recurs year-round, with some seasonality around renovation and building seasons.
Pricing: typically daily or by project length. Day rates are usually a modest fraction of the item's purchase price, and multi-day rentals often carry a discount.
Wear: meaningful. Power tools take real mechanical wear from frequent use, and renters handle them less carefully than an owner would. Functional wear is often invisible until something fails.
The pattern: dependable, repeat demand with steady income, but with depreciation that accelerates in proportion to how often the item rents. High rental frequency is both the income and the cost.
Landscaping and Outdoor Equipment
Demand: strongly seasonal. Mowers, trimmers, pressure washers, and similar equipment rent heavily in yard-work season and barely at all outside it. Regional climate determines how long the season lasts.
Pricing: daily or weekend rates, with seasonal peaks. Weekend demand tends to cluster.
Wear: moderate to high for gas-powered and heavy-duty items, with added upkeep like fuel, blades, and cleaning between rentals.
The pattern: a short, intense earning window followed by long idle stretches. Annual income depends on modeling the full seasonal curve, not the peak month. A host who projects from a busy spring weekend will overestimate badly.
Photography and Event Equipment
Demand: lower rental frequency than tools, driven by shoots and events in your local area. A market with active freelance creative work or frequent events supports this category; one without doesn't.
Pricing: potentially high per-day rates, since the items are expensive and renters compare against buying or renting from a shop.
Risk: the highest of the three categories. Gear is fragile, high in value, and easy to lose or damage. One serious incident can erase many rentals' worth of income, and replacement cost is substantial.
The pattern: fewer rentals at higher rates, with a much fatter downside tail. The economics hinge on whether damage and loss coverage genuinely matches replacement cost, and the before-and-after documentation discipline covered in peer-to-peer equipment rental platforms matters most here.
Category Comparison
Power tools/construction. Moderate to high, year-round. Low to moderate, scales with item value. Moderate, often invisible mechanical wear Landscaping/outdoor. High in season, near zero off-season. Low to moderate. Moderate to high for heavy/gas equipment Photography/event gear. Low to moderate, event-driven. Moderate to high. High: fragile, high-value, loss-prone
Treat these as relative patterns, not quotes. Actual rates and frequency depend on local demand, so check comparable listings in your market before assuming any range applies to you.
How to Calculate Realistic Monthly Income
The most common error is multiplying the daily rate by 30. That assumes the item is rented every single day, which essentially never happens.
The correct estimate has three inputs:
- Achievable daily rate: what comparable local listings actually charge and appear to book at, not the highest rate you've seen.
- Expected rental days per month: your realistic rental frequency, drawn from local demand signals (comparable listings' review activity and recency) and adjusted for seasonality.
- Costs: platform fees, cleaning or upkeep, consumables, and delivery time if you offer it.
Net monthly income = (daily rate x expected rental days) minus fees and costs minus a wear allowance.
The wear allowance is the piece nearly everyone leaves out. Every rental day consumes some of the item's useful life, so a portion of income should be set aside toward eventual replacement. Without it, you're reporting income that's partly just your equipment being spent down.
Depreciation and Whether an Item Is Worth Listing
Rental use accelerates replacement compared to personal use. An item you'd use a few days a year may be rented dozens of days a year, which shortens its life accordingly.
Weigh realistic net income against replacement cost and expected lifespan under rental use. A useful rough test: how many rental days does it take to recover the replacement cost, and does your realistic rental frequency get there within the item's likely life? If payback takes longer than the item will plausibly last under rental use, the item is losing you money however busy it looks. The Turo depreciation calculator models the same value-loss logic for vehicles, and the framework transfers conceptually to high-value equipment.
Worked Example One: A Commonly Rented Power Tool
A mid-priced power tool with steady local demand.
Inputs: a moderate daily rate set from local comparables, and a realistic rental frequency of a handful of days per month, not thirty. Costs include platform fees and a small upkeep allowance.
The naive calculation: daily rate times thirty days, producing an impressive-looking monthly figure.
The realistic calculation: daily rate times the handful of days it actually rents, minus fees, upkeep, and a wear allowance. The result is a fraction of the naive number, but steady and positive, and the item's modest replacement cost means payback is reasonably quick.
The read: a solid, unspectacular earner. It works because the item is cheap enough to replace that accelerated wear doesn't threaten the economics.
Worked Example Two: Higher-Value Photography Gear
A camera and lens kit with strong per-day rates but lower frequency.
Inputs: a meaningfully higher daily rate, but only a few rental days per month at best, and fewer in slow periods. Costs include platform fees, insurance or coverage for replacement value, and careful handling overhead.
The realistic calculation: even at a high day rate, low frequency limits monthly income, and the wear allowance and coverage cost take a real bite. The income is lumpy, and one damage incident or unreturned item can exceed many months of earnings.
The read: potentially worthwhile only if replacement-value coverage is confirmed, documentation is rigorous, and local demand is validated. The risk profile is entirely different from the power tool even though the day rate looks more attractive.
Common Mistakes
Extrapolating monthly income from a daily rate. The central error. Always apply a realistic rental-day count.
Ignoring accelerated replacement timelines. Rental use ages equipment faster than personal use. Income without a wear allowance overstates profit.
Listing niche equipment based on personal value. An item that's precious or expensive to you isn't necessarily in demand locally. Validate demand from comparable listings first.
Skipping coverage checks. Confirm that platform protection or your own insurance covers the item's replacement value before listing anything costly.
Projecting from a peak month. Especially for seasonal categories. Model a full year.
When an Item Isn't Worth Listing
A highly specialized or fragile item with low local demand usually isn't worth renting out. If realistic rental days are few, and one mishap could exceed a year's income, the expected value is negative even when the day rate looks high.
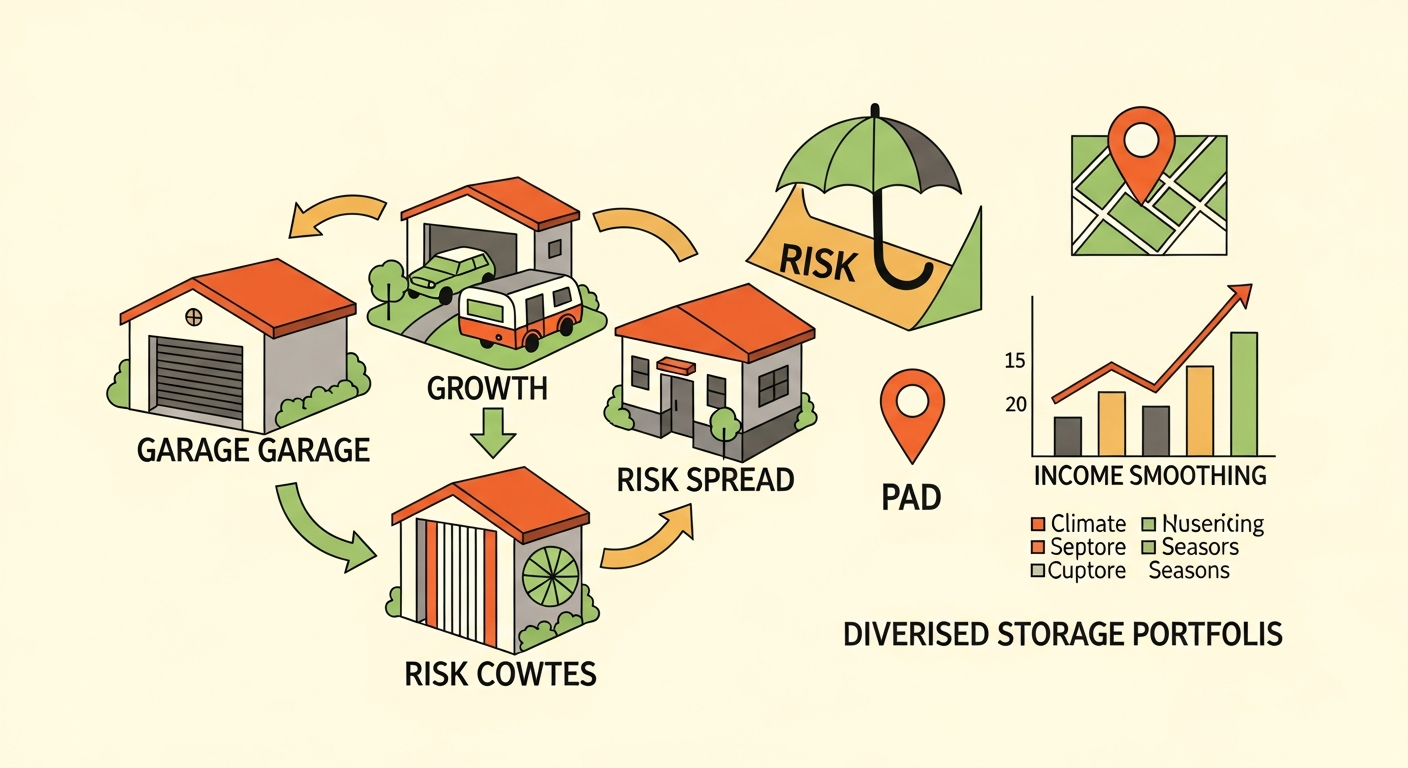
Check comparable local listings for the item. If there are few or none, or they show little booking activity, that's your answer. Keeping the item off the platform is a legitimate outcome of doing the math honestly. If you're weighing space-based alternatives, the Neighbor.com host earnings guide and storage space pricing calculator cover that different economics, and a broader self storage host diversification strategy puts equipment in portfolio context.
Frequently Asked Questions
How do I decide whether an item's replacement cost makes frequent rental worth the wear?
Estimate realistic net income per month, subtract a wear allowance, and compare the resulting payback period against how long the item will plausibly last under rental use. If it pays back comfortably inside that window and coverage matches replacement cost, it's worth listing. If payback is slow or the downside from a single incident is large relative to income, it isn't.
Does bundling related items perform better than listing them individually?
Often yes for things renters need together, such as a full landscaping set or a lighting kit, since a bundle raises the rental value per transaction and simplifies the renter's decision. It also concentrates handoff and documentation work into one exchange. Test it against your local demand; bundling only helps where renters actually want the set.
How much does seasonality matter?
A lot for landscaping and outdoor gear, which can earn most of the year's income in a few months. Model the full year, not the peak.
Should I offer delivery?
It can justify a premium and gives you control over handoff inspection, but it costs time. Price it in rather than absorbing it.
What happens if an item is damaged?
Document condition before and after every rental and report issues promptly through the platform. Confirm current protection terms and coverage limits before listing, since they vary by platform and category.
Can I rely on category averages for my income estimate?
Only as a starting point. Validate against comparable local listings' pricing and apparent booking activity, since demand varies widely by market.
Is it worth pursuing equipment rental alongside space hosting?
It can be, since demand drivers differ, but treat each line on its own numbers. A warehouse space sharing marketplace line, for example, has completely different economics from equipment.
The Takeaway
Realistic tool and equipment rental income starts with honest inputs: a daily rate grounded in local comparables, a rental-day count that reflects real frequency rather than thirty days, and a wear allowance that reflects how fast rental use spends the item down. Power tools tend toward steady, modest income; landscaping gear is seasonal; photography and event gear pairs high day rates with low frequency and high risk. Run the numbers for each item and validate demand locally before listing anything.