Neighbor.com host earnings vary enormously by space type, location, and — more than either of those — occupancy rate, which is why flat "earn $X per month" numbers floating around are mostly misleading. This guide breaks down what actually drives earnings per listing, what realistic income ranges look like across space types, and how to model a multi-space portfolio instead of guessing from a single headline example.
This is written for operators running or considering multiple storage listings as a business line, not someone renting out one spare closet casually. You already know what Neighbor.com is; what follows is the economics.
What Actually Drives Earnings Per Listing
Five factors explain most of the variance in what a given space actually earns:
Space type. Garage bays, driveway or open vehicle space, RV pads, warehouse space, and climate-controlled rooms all command different rates and attract different renter demand. Vehicle and RV storage tends to have more consistent, longer-duration demand in many markets; climate-controlled space commands a premium but only where local demand for it — often driven by climate and what people are storing — actually supports the higher price.
Size. Larger spaces earn more in absolute terms but don't always earn more per square foot. A compact space sized right for a common need (a single vehicle, a handful of boxes) can outperform an oversized space priced proportionally, simply because it matches more renters' actual requirements.
Location. Proximity to dense urban areas with limited home storage, or to seasonal demand drivers (marinas, ski areas, RV corridors), pushes both achievable rate and occupancy well above a similar space in a low-demand area. Location affects occupancy at least as much as it affects headline price, which is easy to underweight when comparing rate estimates from a different market.
Climate control and security features. Climate control, keypad or gated access, and visible security cameras all support higher rates, but only convert to higher realized income if local demand actually values those features enough to fill the space at the higher price. Adding these features without checking local comparables is a common way hosts overinvest relative to actual return.
Access and convenience. Simple things — 24/7 access, easy vehicle maneuverability, ground-level entry — measurably affect both rate and occupancy, since they reduce friction for the renter's actual use case.
How to Set and Adjust Pricing Over Time
Start by pricing against actual local comparables on the platform, not a generic per-square-foot rate pulled from a different market. Two spaces of identical size in different cities can justify very different rates purely based on local supply and demand.
Once listed, watch occupancy more than price. A space sitting empty at a rate that looks reasonable compared to nearby listings usually means the price needs to come down, not that the market lacks demand. Conversely, a space that fills within days of listing is a signal you likely priced under the market and can test a higher rate on renewal.
Revisit pricing on a regular cadence — quarterly is reasonable for most operators — rather than setting it once at listing and leaving it static. Local supply changes as other hosts list or delist space, and demand shifts seasonally in many markets, particularly for vehicle and RV storage.
Realistic Earnings Ranges: Single Space vs. Multi-Space Portfolio
A single space's realistic monthly income depends on the interaction of rate and occupancy, not rate alone. This is the single most common source of overestimation in storage-hosting content: citing a strong headline rate from a high-demand market without adjusting for a more typical occupancy rate.
Single space, realistic range. Across most markets and space types, monthly net income for one actively-managed space tends to land in a fairly wide range once occupancy is factored in — a driveway or small garage space in a lower-demand area realistically nets far less per month than a climate-controlled unit in a dense urban market with strong demand. Treat any single number you see elsewhere as tied to a specific market and space type, not a general benchmark.
Multi-space portfolio. Income scales roughly linearly with additional spaces only if each new space is priced and positioned similarly to the first — a common overreach is assuming a second or third space in the same property or nearby will perform identically to the first, when local supply/demand for that specific space type may already be more saturated. A guide on Neighbor multi-space host strategy covers how to sequence adding spaces correctly.
The pattern worth internalizing: portfolio-level income is far more predictable and stable than any single space's monthly figure, since occupancy fluctuations across multiple spaces tend to average out rather than compound.
The Fee Structure and What It Does to Net Income
Neighbor.com charges a processing fee — a percentage taken from the renter's payment before payout, alongside features like a host guarantee (a protection covering certain damage or non-payment scenarios, subject to specific terms). Because this fee comes off the top, it changes the real yield of a space meaningfully compared to the listed rate.
A common host mistake is calculating expected income off the gross listed rate without factoring in the processing fee, then being surprised when actual payouts run lower than projected. Always model net income after the fee, not before it.
Specific fee percentages, payout thresholds, and host guarantee coverage limits change over time and should be verified against Neighbor's current host terms directly rather than treated as fixed — this guide won't cite a specific percentage as permanent, since it's exactly the kind of figure that goes stale in published content.
Why Occupancy Rate Matters More Than Headline Pricing
This is the single biggest driver of realistic annual income, and the one most overlooked by hosts pricing off someone else's success story.
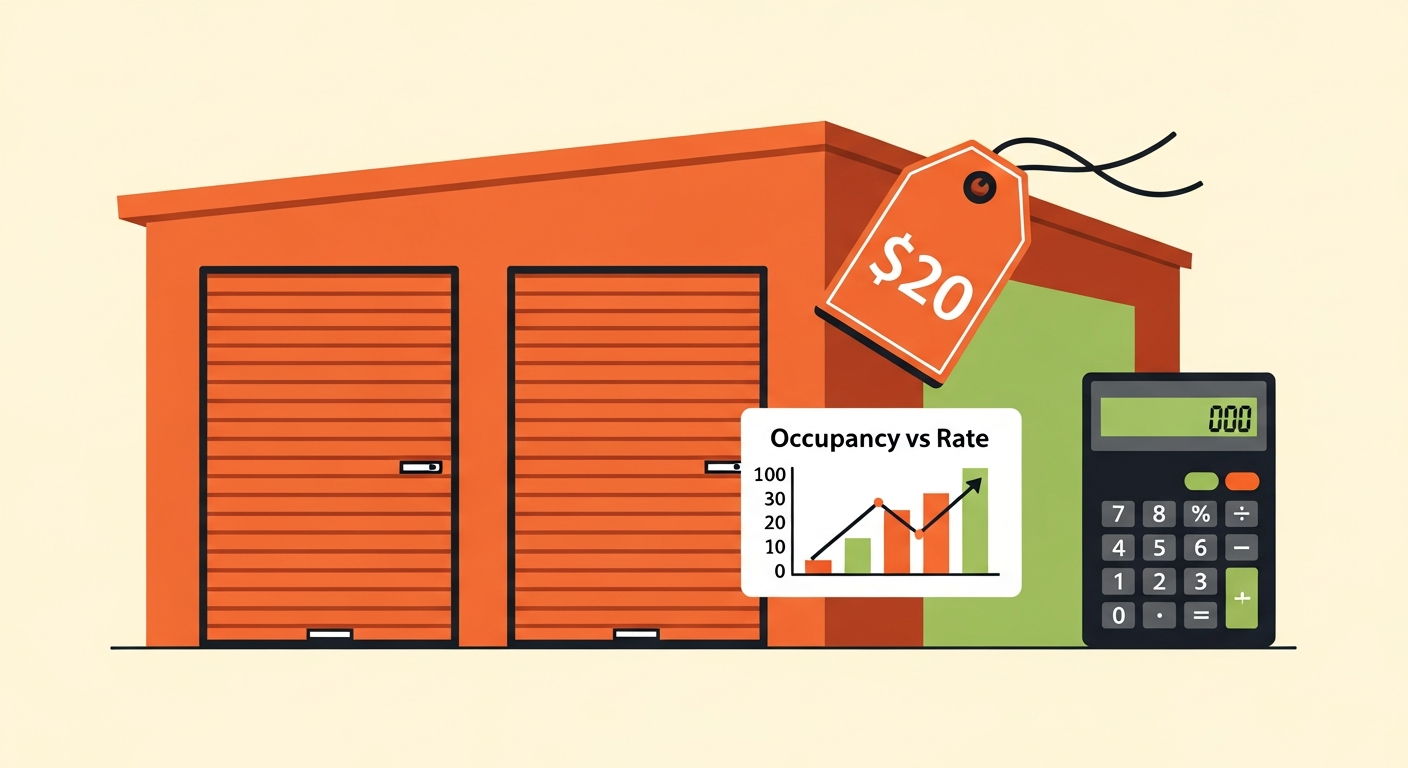
A space priced aggressively high with low occupancy can easily net less annual income than the same space priced moderately with high, consistent occupancy. The math is straightforward once you run it: twelve months at 40% occupancy at a premium rate frequently loses to twelve months at 80% occupancy at a more moderate rate.
Neighbor host occupancy rate optimization — actively managing pricing, photos, and listing details to keep a space consistently booked rather than intermittently vacant — usually moves annual income more than any single pricing decision does. This is also why comparing your space against a headline "top earner" example from a different market is close to meaningless without knowing that market's occupancy dynamics.
Space Type Earnings Scenarios
Driveway / open vehicle space. Estimated monthly rate: lower end of the range, varies by location. Typical occupancy: moderate, seasonal in many markets. Estimated net monthly income after processing fee: modest, positive but limited without volume.
Garage bay (uncontrolled). Estimated monthly rate: mid-range. Typical occupancy: moderate to high in dense areas. Estimated net monthly income: moderate, meaningfully better than open space in a similar location.
Climate-controlled room. Estimated monthly rate: higher end of the range. Typical occupancy: depends heavily on local demand for climate control. Estimated net monthly income: highest per-space potential, but only where local occupancy supports it.
RV / large vehicle pad. Estimated monthly rate: higher end, location-dependent. Typical occupancy: can be high near RV corridors or marinas, low elsewhere. Estimated net monthly income: strong where demand is location-matched, weak otherwise.
Run your own space through SharingShell's storage space pricing and income calculators rather than relying on this summary alone — both are built to model your actual local rate and occupancy assumptions rather than a generic estimate.
Common Mistakes When Estimating or Scaling Storage Income
Overestimating occupancy based on a best-case example. Headline earnings stories almost always describe a high-demand market at strong occupancy. Applying that occupancy assumption to a different market is the most common way hosts overestimate expected income.
Underpricing climate-controlled or vehicle space relative to its actual demand. Climate control and vehicle-specific space often justify a real premium, but only in markets where demand supports it — pricing it like standard storage space leaves money on the table where the premium is justified, while overpricing it where demand doesn't support the premium leaves it vacant instead.
Ignoring the processing fee when calculating expected yield. Projecting income off the gross rate rather than net-of-fee income consistently overstates real return, and compounds across a multi-space portfolio if never corrected.
Assuming linear scaling across additional spaces. A second or third space doesn't automatically perform like the first, particularly if it competes for the same local demand pool.
Treating storage income as separate from the rest of an asset portfolio. For an operator running Neighbor listings alongside Turo or Airbnb assets, storage income is one line in a broader picture, not a standalone business to evaluate in isolation. A guide on sharing economy portfolio diversification covers how storage income typically fits alongside other asset types.
Protecting the Income You Do Earn
Realized income only matters if it's protected against the scenarios that actually threaten it — property damage, non-payment, or a renter dispute. Neighbor host insurance coverage and the platform's host guarantee protection are worth understanding together, which matters more as the number of spaces — and the total value exposed — grows.
If you're managing more spaces than you can personally handle day-to-day, a Neighbor co-management service is worth comparing against the time cost of managing tenant communication and access coordination yourself across a growing portfolio.
If you haven't listed a space yet and are working through the setup itself, a guide on how to list storage space on Neighbor covers that process before earnings optimization becomes relevant.
Model Your Numbers Before You List
Before committing a space to Neighbor.com, or before adding a second or third listing to an existing portfolio, run your specific space through SharingShell's pricing and income calculators. Peer-to-peer storage passive income is genuinely achievable as a business line, but only when priced against real local comparables and modeled net of fees — not against someone else's best-case headline number from a different market entirely.
Frequently Asked Questions
How much can I realistically earn per storage space on Neighbor.com?
It depends heavily on space type, location, and occupancy rate, which is why any single flat number should be treated skeptically. A driveway space in a low-demand area and a climate-controlled unit in a dense urban market can differ by a wide margin in realized monthly income, even at similar listed rates.
Is climate-controlled storage always worth the higher rate?
Only where local demand supports it. In markets with genuine demand for climate control, the premium is usually worth it; in markets without that demand, a climate-controlled space priced at a premium can sit vacant longer than a standard space, which hurts annual income more than the rate premium helps it.
How does the processing fee affect my actual payout?
The fee is deducted from the renter's payment before payout, so your real net income is lower than the listed rate suggests. Always calculate expected yield off the net figure, and verify the current fee percentage against Neighbor's host terms directly, since marketplace fee structures change over time.
Does adding more storage spaces always increase income proportionally?
Not automatically. A second or third space performs like the first only if it isn't competing for the same local demand pool — adding a similar space type in the same building or area can cannibalize occupancy across your own listings rather than adding fully incremental income.
What's the biggest mistake new multi-space hosts make with earnings projections?
Estimating income from a best-case example in a different market instead of their own local occupancy and rate data. Occupancy rate, not headline price, is the bigger driver of realistic annual income, and it's the variable most often ignored in overly optimistic projections.
The Takeaway
Neighbor.com host earnings are driven by occupancy rate first, space type and location second, and headline pricing last — model your specific space against local comparables, always calculate net of the processing fee, and treat multi-space scaling as an incremental test rather than an assumption of linear income growth.